3.2 Node2Vec:
Introduction -
Node2vec is an algorithmic framework for representational learning on graphs. Given any graph, it can learn continuous feature representations for the nodes, which can then be used for various downstream machine learning tasks.
Compared to the simple graph we have for Word2Vec, Node2vec can be applied to complexly structured graphs that are “ (un)directed, (un)weighted, or (a)cyclic.” To accomplish that, Node2vec generates biased random walks from each node of the graph. This provides a way of balancing the exploration-exploitation tradeoff by smoothly interpolating between BFS and DFS.
Implementation -
Using random walks through the corpus, we created multiple documents as an input into the Gensim model for vectorizing embeddings using sentences. These embeddings were then analyzed using their corresponding graph clusters.
The purpose of random walks is to add context to the Application → API nodes, by looking at corresponding applications or APIs that are neighbors to the starting applications.
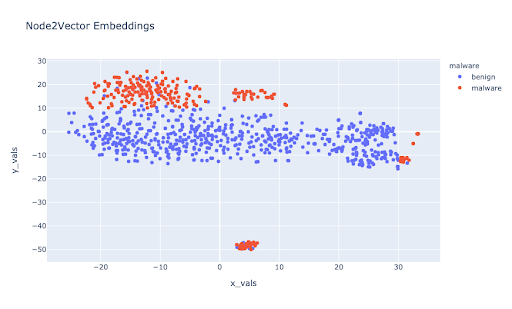
In the figure under node2vec above we clearly see the distinction between the two classes. On visualizing this on a 2-Dimensional plane it is now possible to use lighter classification models to help classify benign vs malware applications.
Analysis -
Similar to node2vec, a distinct number of hyperparameters and model choices influenced the project.
The following are a few hyperparameters that had a large impact on the performance of the model -
- Walk length: The count of nodes in each random walk
- P: Return hyperparameter - controlling the probability of going back to a previous node
- Q: Input hyperparameter - controlling the probability to traverse to undiscovered parts of the graph
For node2vec, these parameters above greatly influence the sampling strategy and how specific they’re intended to be.
Since the risk factor for misclassifying a malware app as benign is considerably high, we started testing the model and embeddings with a lower probability of backtracking or exploring different parts of the graph. Thus the window size of 2 and 1 respectively.
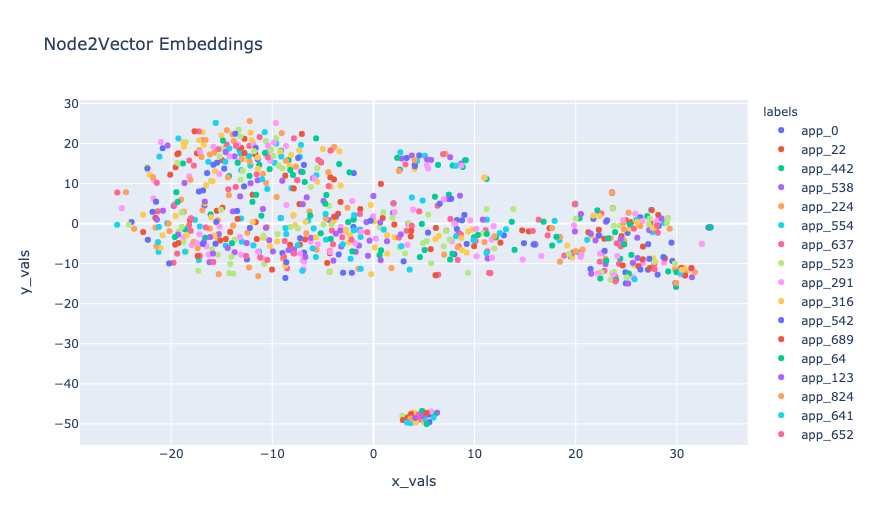
On running the model and creating sentences the graph below shows the distribution of each app from a 2D representation of the graph embeddings. A point represents an app in the graph.
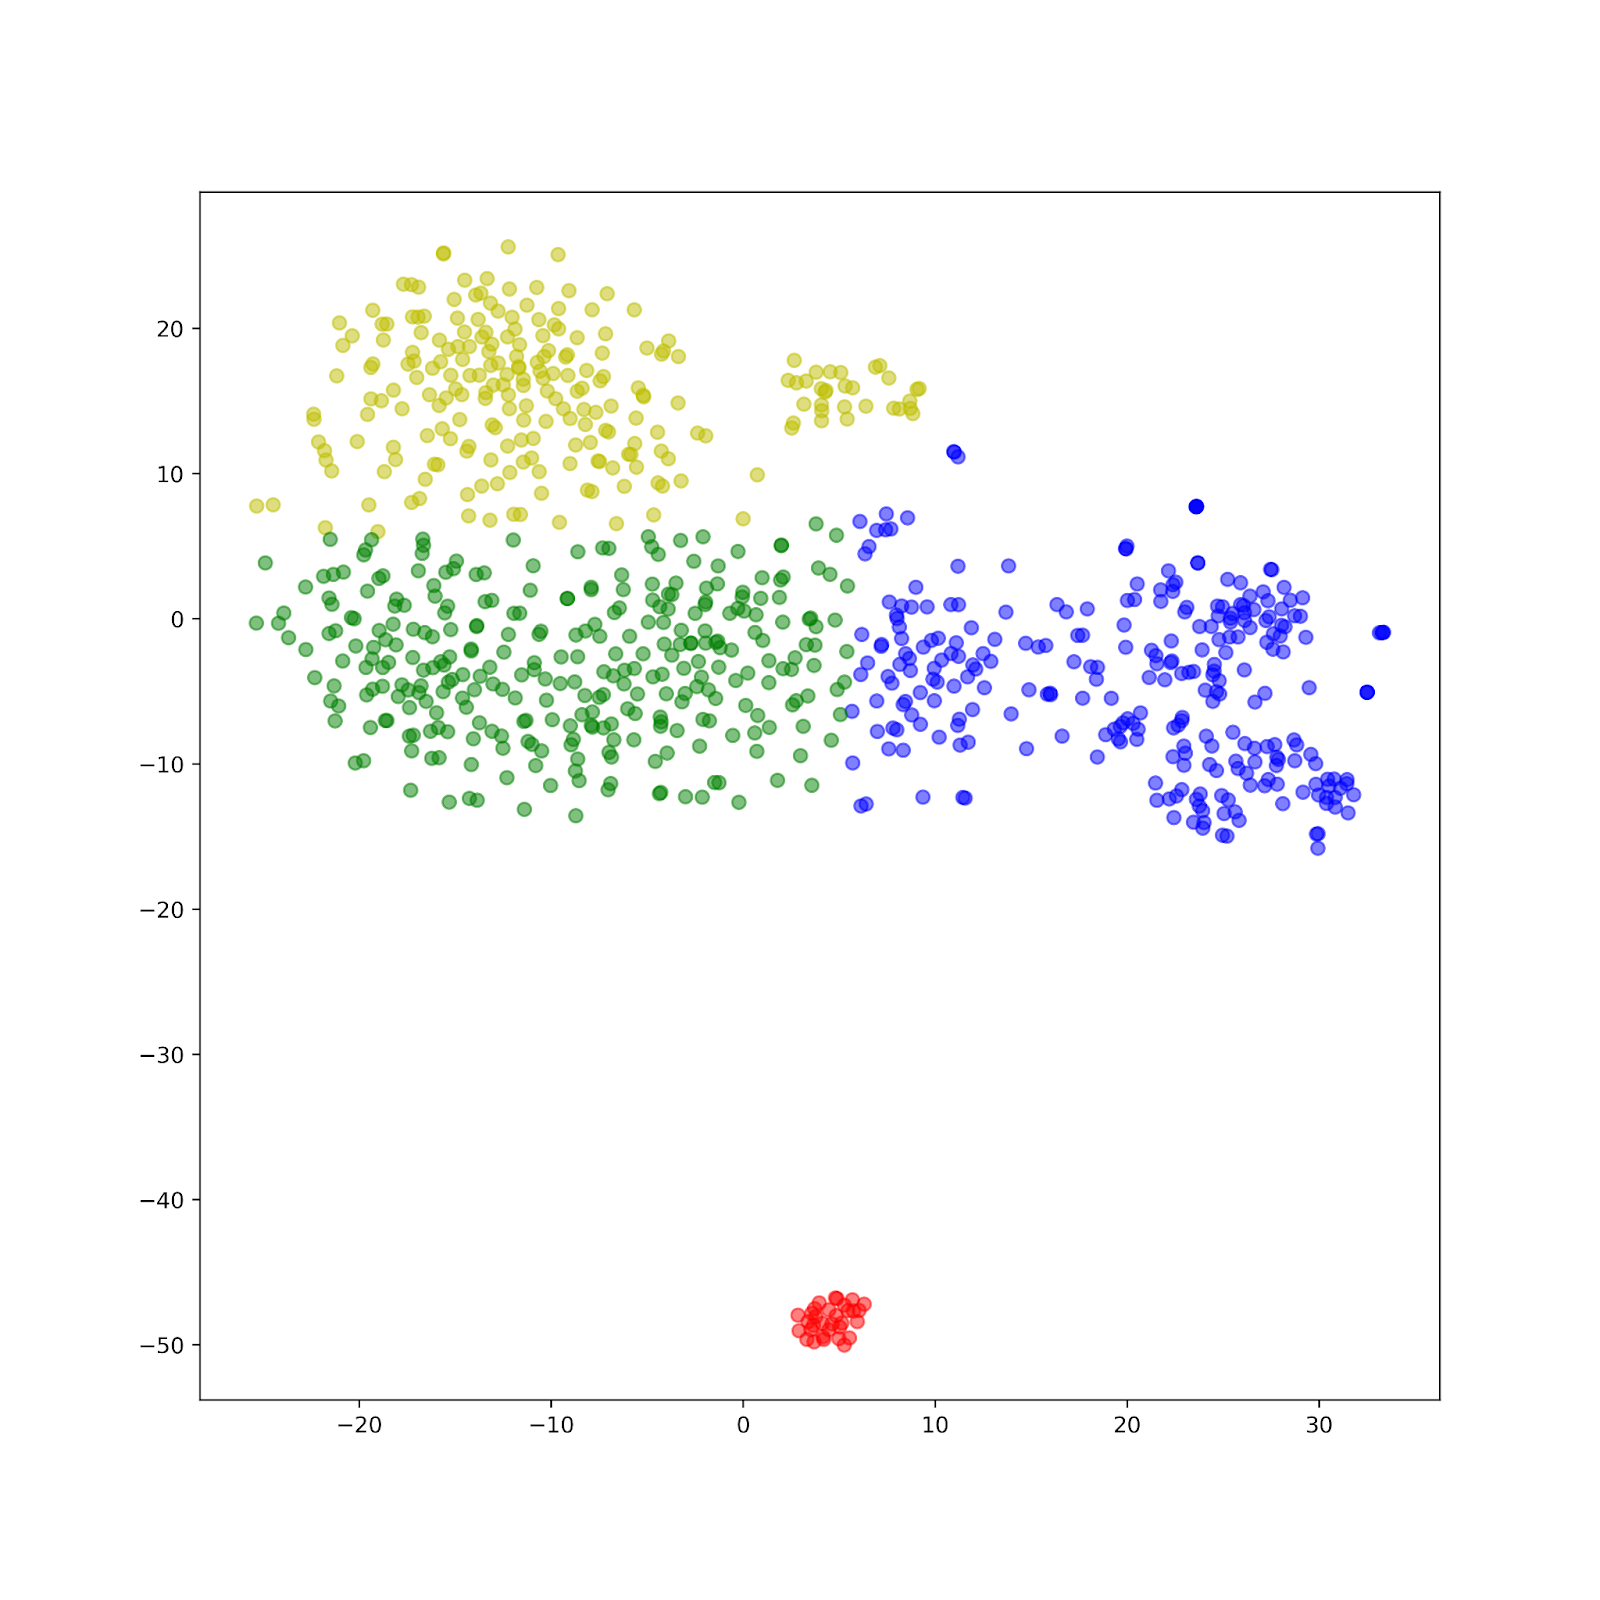
Then we use k-means clustering method to classify the apps from malware to benign apps. The graph below shows the result when k = 2, k=3, and k=4.(see pics below)
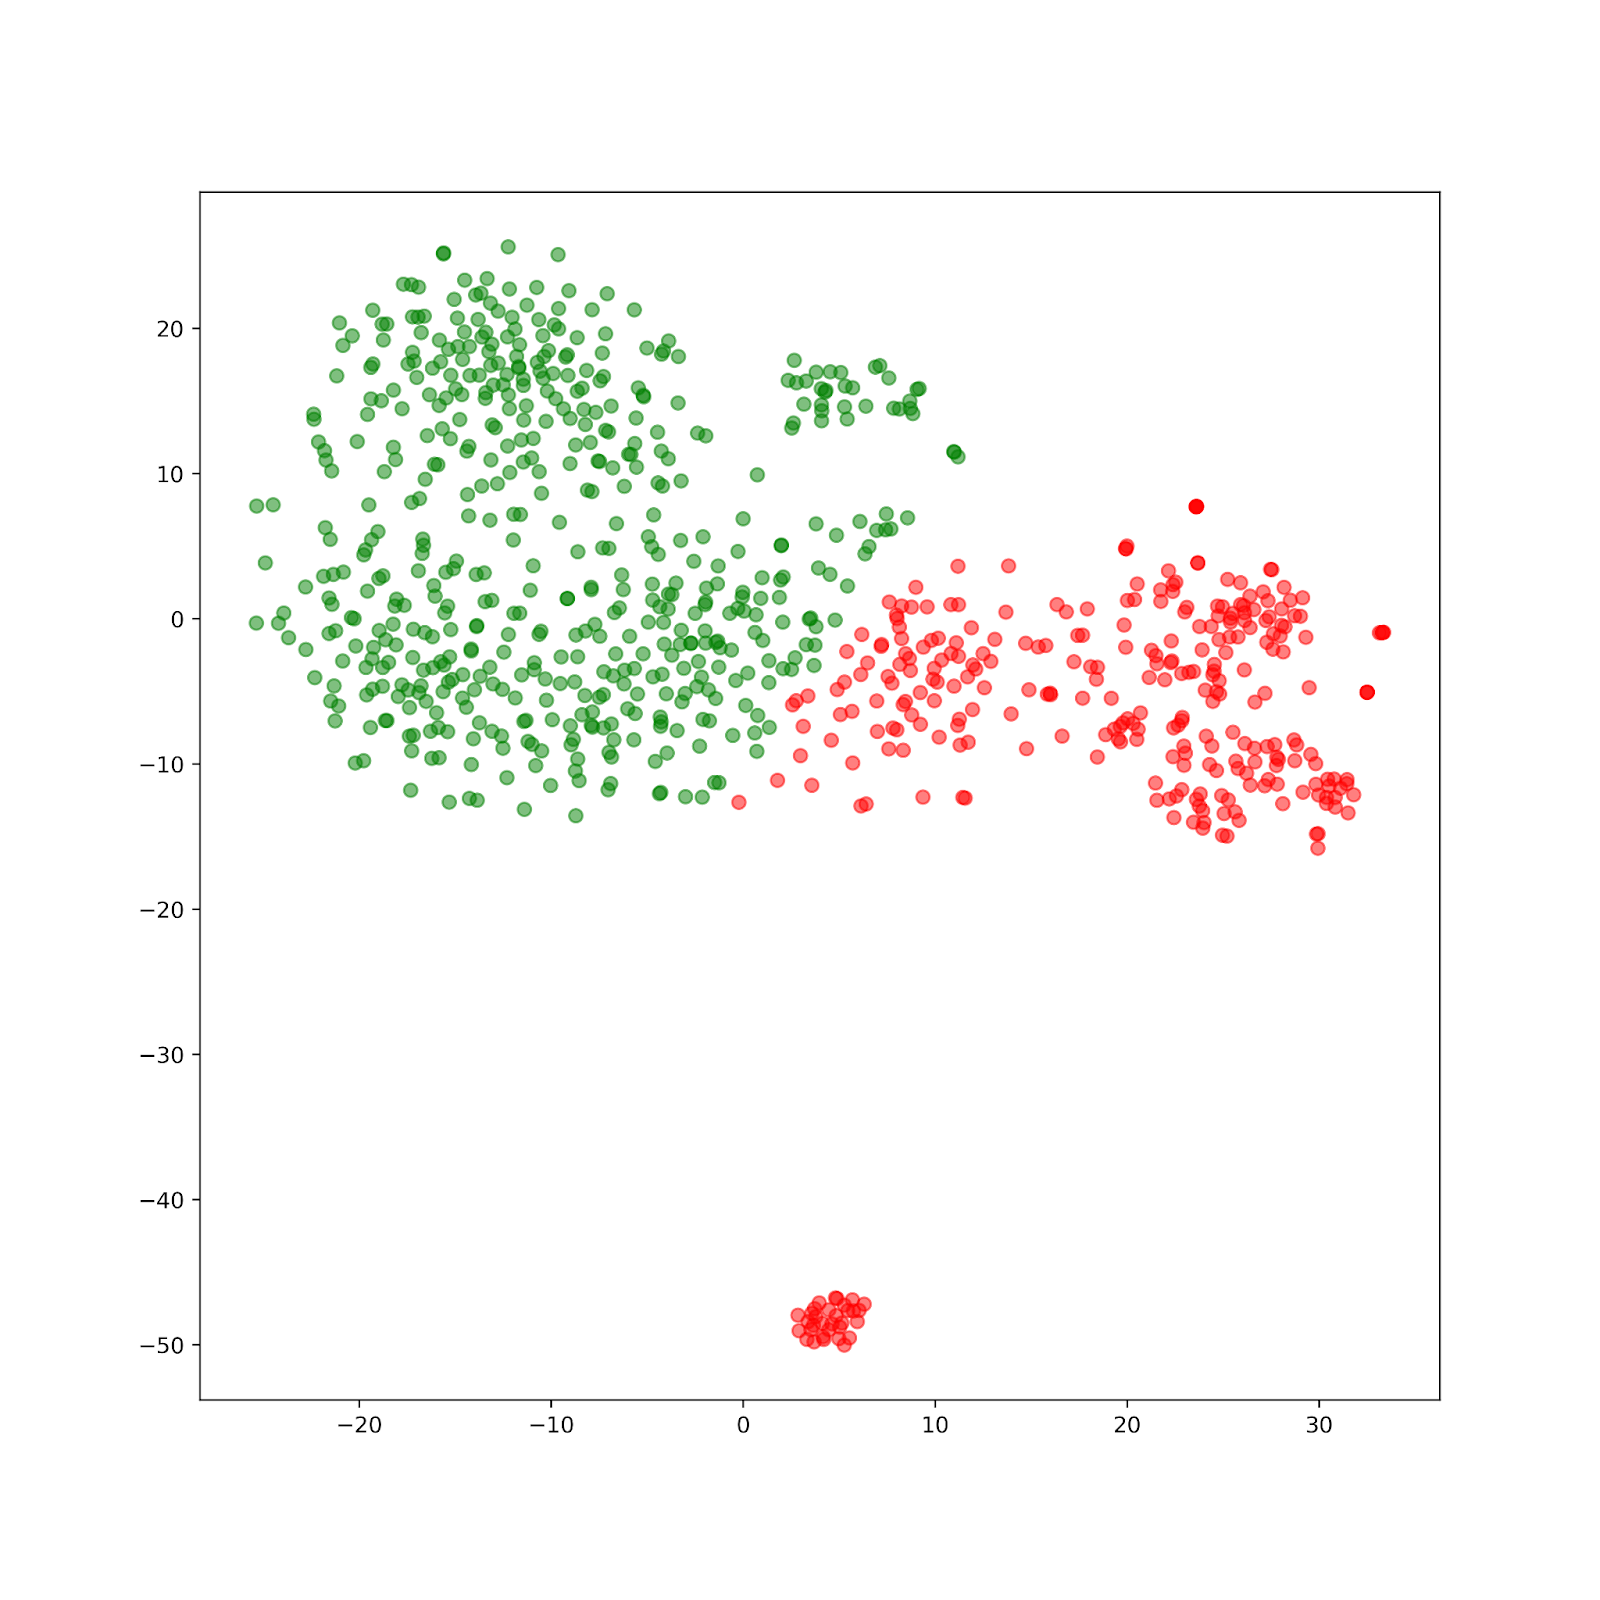
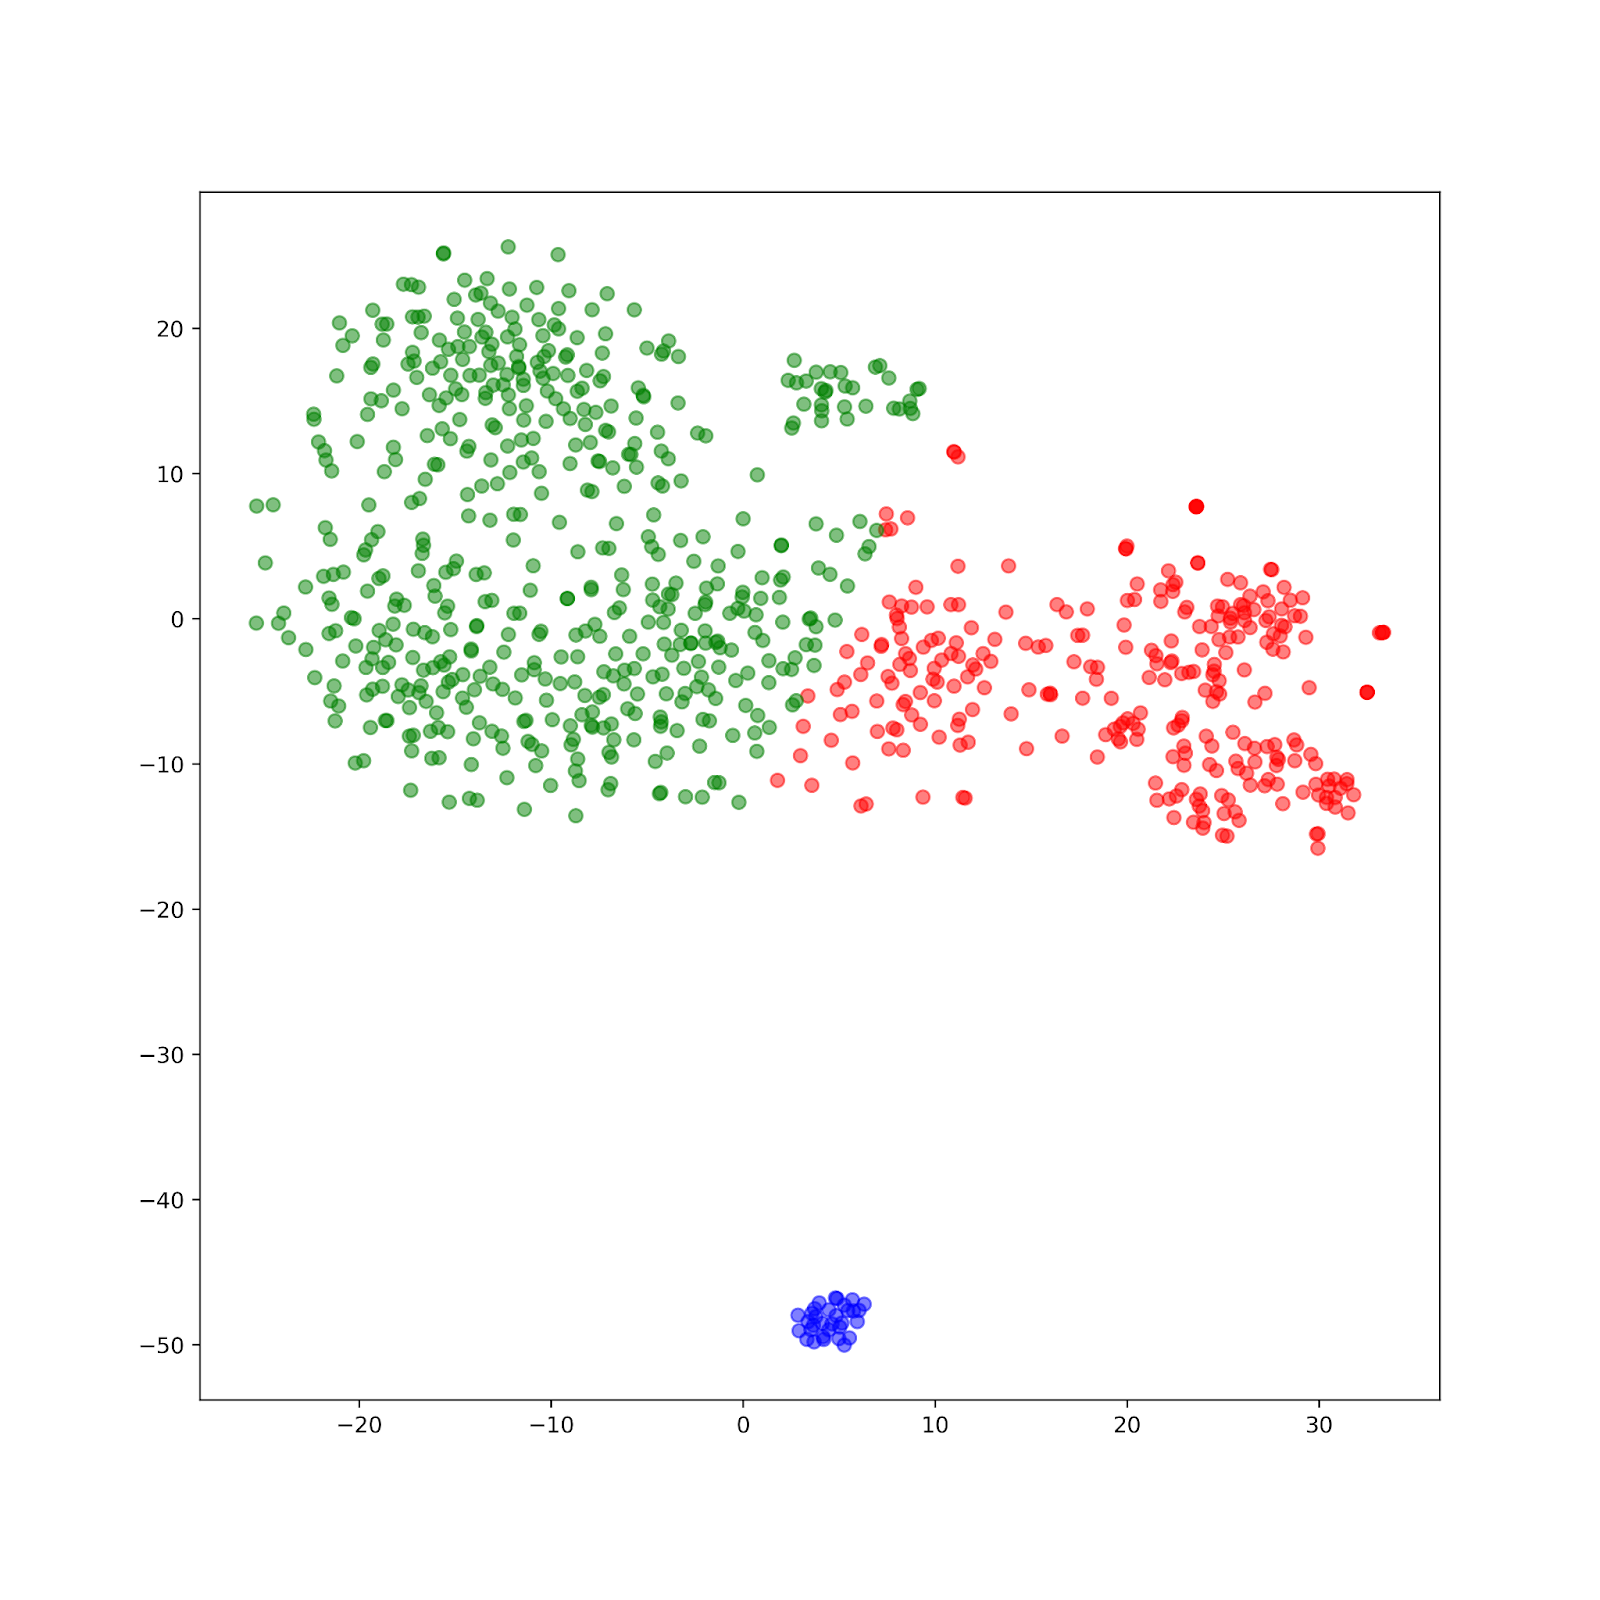
Here is the accurate plot differentiating malware from benign apps:
Comparing the plots, we can see that k-means clustering provides insight into the natural clusters of the graph. As all the k-means clustering separates clusters horizontally, we can assume that more than 50% of APPs are misclassified. Misclassifying malware as a benign app could cause a huge loss, so K-means clustering isn’t a good algorithm for detecting malware. Looking at the second graph, we see a distinct boundary between the application types. Further analysis would look at different meta paths that could better identify this boundary in addition to classifiers to elevate the creation of decision boundaries.
On evaluating multiple classification models for Node2vec we found that Support Vector Machines provided us with the optimal Accuracy and recall tradeoff. We used Support Vector machines with the radial bias function(RBF) kernel, along with a higher than default regularization constant of 5. Performance of Node2Vec embeddings using an SVC -
| P | Q | Walk Length | Accuracy | F1 Score |
|---|---|---|---|---|
| 2 | 1 | 100 | 94% | 0.92 |
| 2 | 2 | 100 | 94% | 0.92 |
| 1 | 2 | 100 | 91% | 0.91 |
| 3 | 3 | 100 | 89% | 0.88 |
A similar observation can be made with the word2vec graph showing the difference between the two classes, here even a linear relationship could be identified between the two classes.